Motion Lab
Purpose
- Create a Displacement vs. Time graph and have another person match your graph with actual motion.
- Gain competence in the use of motion detector and related equipment.
- Understand the relationship between position vs. time, velocity and acceleration.
Materials
1. TI-84 Calculator-Based Lab Unit (CBL-II)
2. Motion detector
3. Computer with LoggerPro software
2. Motion detector
3. Computer with LoggerPro software
Data and Analysis
- Develop a position vs. time story that describes a body in motion incorporating at least the following four types of motion.
ii. moving with constant velocity
iii. moving with variable negative velocity
iv. moving with variable positive velocity
2. Illustrate the story on a position vs. time graph. Use a legend to cross reference sections of the graph with the corresponding sections of the story.
A Typical Band Practice
1) Cody Lovick was standing at attention, when it slipped—he called Jeff ‘Baldy.’ Without thinking, he took off running, trying to get away from one angry Marching Director. He looks over his shoulder, sees that Jeff is almost literally flying toward him, and he sped up. A lot.
2) He went a whole 50 yards until he ran into the one car in the parking lot—somebody hadn’t listened to the numerous announcements and had left their car in the lot. Jeff finally caught up with him and forced him to do 30 push-ups.
3) Tired and sore, he slowly ambles toward his original position. But after 20 yards, Mitchell yells at him to GET THERE NOW, so Cody accelerates to a jog, then a run, until he reaches his spot.
4) The instant Cody gets to his spot, Jeff calls the end of practice. Cody, depressed, exhausted, and embarrassed, walks at a constant speed toward the band room.
Conclusion
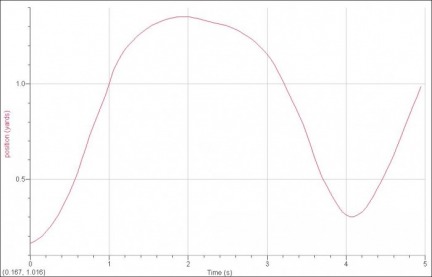
Creating an ideal graph was much easier than creating the actual graph using the motion detector. It was almost impossible to stop completely; changing directions instantaneously was impossible.
The graph follows a scale of 1 second = 16 seconds in the story. As he accerlerates away from Jeff, the graph shows this quite well, as well as the acceleration toward his spot. The straight line at the end shows his constant velocity in the positive direction. However, when his position is supposed to be constant, the graph does a lovely curve. This is a human error--it is immpossible to stop completely, as well as a difficulty with the equipment; it was hard to find the best try with the pixels of a TI-84 calculator.
The graph follows a scale of 1 second = 16 seconds in the story. As he accerlerates away from Jeff, the graph shows this quite well, as well as the acceleration toward his spot. The straight line at the end shows his constant velocity in the positive direction. However, when his position is supposed to be constant, the graph does a lovely curve. This is a human error--it is immpossible to stop completely, as well as a difficulty with the equipment; it was hard to find the best try with the pixels of a TI-84 calculator.
