Measurements
String--95.5 cm
Mass--100 grams = .1 kg
Mass of pulley: 12.7 grams = .0127kg
Radius of Pulley: 21.5 mm = .0215m
Mass--100 grams = .1 kg
Mass of pulley: 12.7 grams = .0127kg
Radius of Pulley: 21.5 mm = .0215m
Purpose
Prove the validity of I = M*R^2
Equipment
- Pulley
- Hanging Mass
- Motion Detector with CBL Data acquisition.
- String
Procedure
- Tie a string to the end of a mass, and also to a pulley.
- Set up the pulley at the the end of a rod, hanging off a table.
- Arrange the motion detector underneath the weight (as it hangs off the table) to look up at the to-be-falling weight.
- Set up the motion detector for appropiate intervals in data points and an appropriate length of time to collect the data. (It will be a fairly quick experiment)
- Drop the weight from a tightly-wound pulley and analyzxe the motion detector data.
- Be sure to mass both the weight and the pulley.
Data
Time Meters
Squared
0.124 0.988186
0.13 0.978191
0.135 0.970416
0.141 0.952368
0.147 0.939874
0.154 0.930989
0.16 0.924047
0.167 0.913774
0.173 0.917661
0.18 0.906555
0.187 0.894893
0.194 0.882676
0.201 0.869904
0.208 0.856299
0.215 0.842416
0.223 0.8277
0.23 0.812151
0.238 0.796324
0.246 0.779943
0.254 0.760507
0.262 0.744958
0.2704 0.726355
0.279 0.707751
0.287 0.688315
0.296 0.668046
0.305 0.6475
0.314 0.625842
0.323 0.604185
0.332 0.584471
0.341 0.561981
0.35 0.53949
0.36 0.519777
0.369 0.495065
0.38 0.470353
0.389 0.42454
0.399 0.400384
0.42 0.354015
0.43 0.340409
0.44 0.318752
0.452 0.285155
0.473 0.226847
0.484 0.198526
0.496 0.170482
0.507 0.15771
0.518 0.12689
0.53 0.126335
0.542 0.129111
Data Analysis
Acceleration based on Data
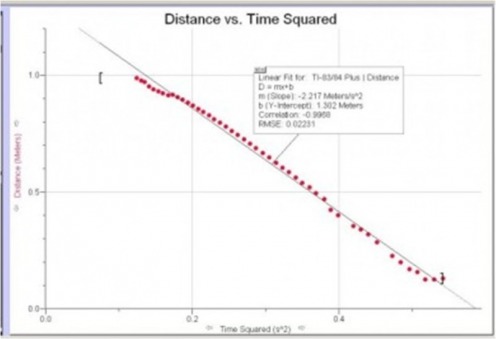
Based on our equation, delta y= .5a*t^2
a should be equal to the slope of the graph, multiplied by two.
m = -2.217
a = -4.424 --Based on the Data
a should be equal to the slope of the graph, multiplied by two.
m = -2.217
a = -4.424 --Based on the Data
Calculated Data
Moment of Inertia of the Pulley should be about 1.365*10^-4
Where
I = M*R^2
I = 0.0127*0.0215^2
I = 1.365*10^-4
Based on the Data, the Moment of Inertia of the Pulley should be about 1.3*10^-5, because
Torque = I*alpha
T = F x R
F x R = I*alpha
m*g*r = I*a/r
.1*(-9.8)*.0175 = I*-4.424/.0215
1.3*10^-5 = I
The percent error between the two is (1.365*10^-4 - 1.3*10^-5)/(Average of the two)
Is about a 200% Error.
Conclusion
Because the Percent error was so great, the model provided does not seem to be accurate. This could be due to many reasons.
1) The useable radius of the pulley will change as the string falls. With every revolution, the affective radius will shrink by the width of the string.
2) When the data was analyzed, certain data points were labeled as 'extranious' and removed. This was not a very exact process--anything could be labeled 'extranious' if it didn't fit the curve almost exactly. With each point removed, it changed the best fit line, and therefore the slope, throwing the calculations ascew.
3) The Motion Detector had a hard time picking up nothing but the weight. We attached an index card to the bottom of the mass so the detector could 'see' it, but the air resistance could have, too, interfered with the data calculations.
4) While the weight of the string was small, it could have had a minute affect on the data colelcted.
Ways to improve the experiment:
-Attach the pulley to a longer rod, pushing it further from the table and therefore, farther from interferance.
